I’ve just finished reading Stephen Jay Gould’s excellent book Wonderful Life (again) and it got me thinking about random trees.
In case you haven’t read it, Wonderful Life is about the fossil bed known as the Burgess Shales which contains extrordinarily well preserved fossils of soft and hard-bodied animals from a period just after the so-called Cambrian Explosion. The Cambrian Explosion marked the period when the seas first “exploded” with an enormous range of large, multicellular animals with hard shells that preserve easily. In the 1980s a detailed re-evaluation of the fossils found in the Burgess Shales provoked a scientific revolution in paleontology, because it turns out that only a small percentage of those fossils have any direct living descendants, and many of them represent previously unknown phyla (basic types of animals.) This did not fit comfortably with the established notion of evolution as ordered progress, with the basic groups of animals established early on and forming a predictable lineage all the way from microbe to man at the pinnacle. Rather it paints the picture of extinction being the norm, and the survival of one group or another very much in the hands of chance and historical contingency. The book is not an argument against Darwinism but rather a re-evaluation of some of its finer points. Crudely put, it’s not arguing against the existance of a Tree of Life, just questioning what shape the tree is.
Anyway with that in mind, and the somewhat vague hand-drawn trees in the book leaving my curiosity piqued, I started wondering what any real evolutionary tree might look like. Of course it’s impossible to ever produce an algorithm that will accurately represent a real evolutionary sequence, so I thought to keep it very simple.
We start with a “first progenitor“. It has two choices: form two new species or die out.
Each new species has the same option at the next toss of the coin. That’s it. In perl it would look something like this:
|
|
sub tree { my $tree = {}; my @nodes = ($tree); while (@nodes) { my $node = shift @nodes; if (rand >= 0.5) { my $l = {}; my $r = {}; $node->{l} = $l; $node->{r} = $r; push @nodes, $l, $r; } } } |
So there’s a 1/2 probability that the thing will never get started, and you’re left with a stump rather than a tree. But with 2 children, there’s only a ¼ chance that they will both die out, and if they both survive then there are 4 grandchildren, and so on. This code has a definite probability of running forever.
It turns out that if you run this a large number of times, and add up the number of each depth reached, you get a curve that asymptotically approaches zero at infinity:
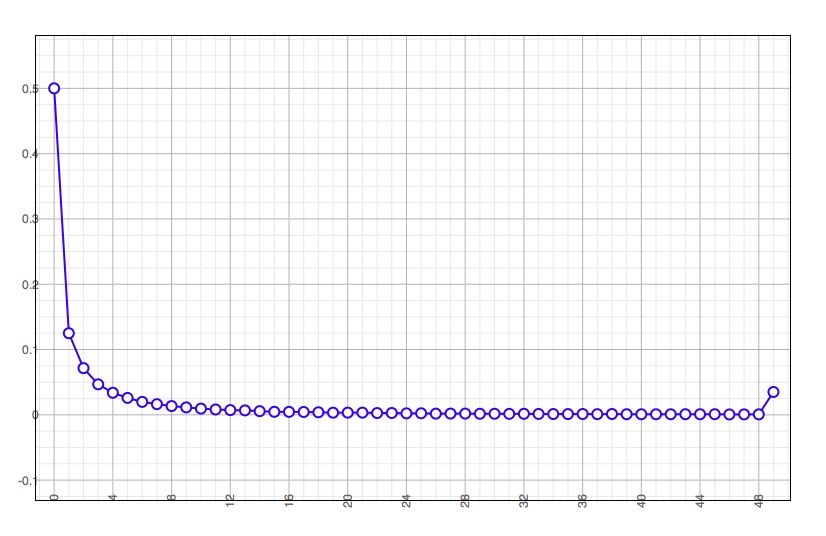
The graph is normalized so the trees of depth zero come out at 0.5. The little kick at the right is those that reached the maximum depth in my test.
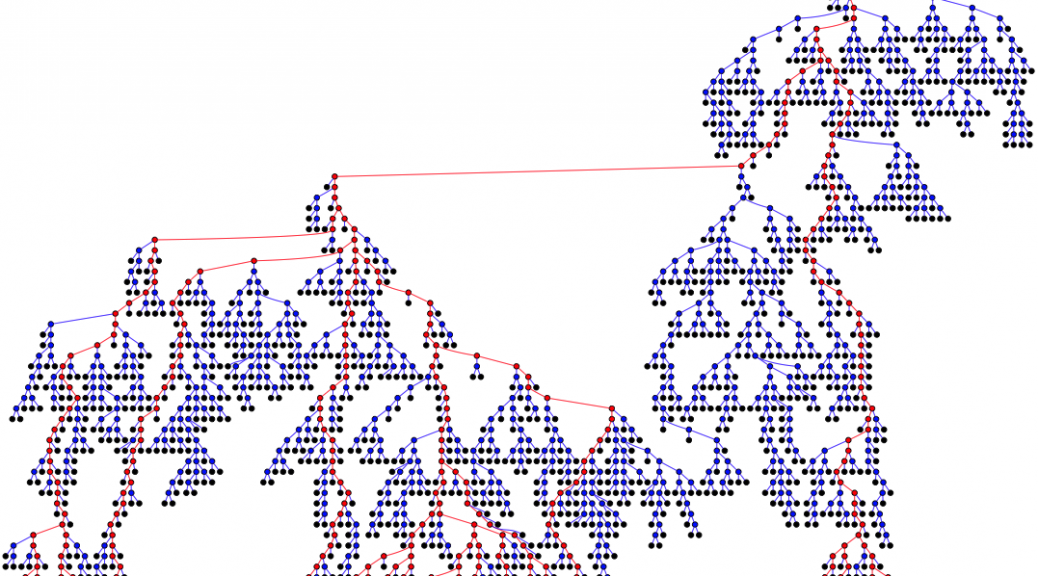
So what do these trees look like? I’ve given the game away by using a picture of one of them as the featured image for this post. As for generating the images, the excellent GraphViz comes to our rescue. With a little jiggery-pokery we can get the above perl code to produce a
.dot file that we can feed to GraphViz and get a picture. I’ve extended the code to color nodes and vertices red if they are “survivors” (have descendents at the limiting depth) and black if they represent a species with no descendants. I’ve also changed the code to try again repeatedly until it generates a tree that reaches a limiting depth. Here’s a representative:
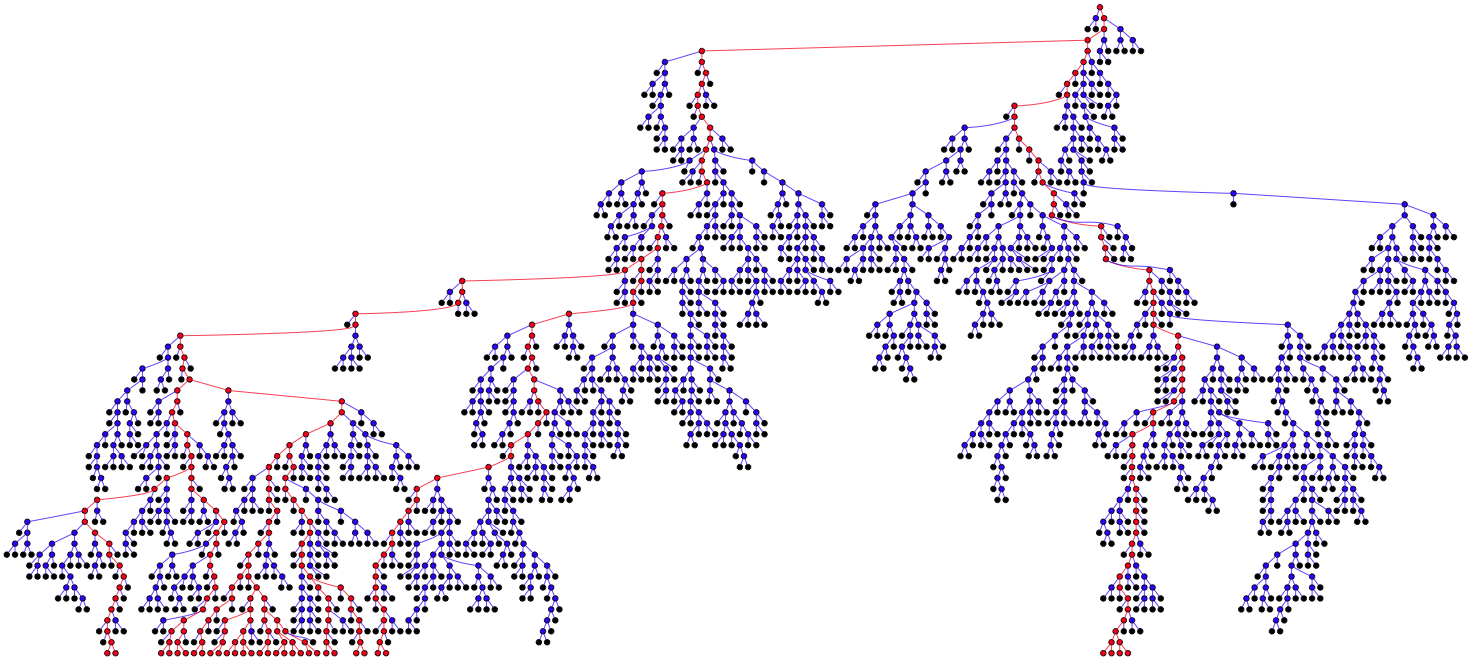
The limit was set at 60, so assuming 2 million years to create a species (I remember that figure from somewhere, I have a bad habit of throwing up unverified facts) this represents about 120,000,000 years of evolution from a single common ancestor. The interesting thing here I think is that the majority of branches don’t make it. Extinction is the norm, even for apparently large and flourishing branches. Apparently insignificant branches can suddenly flourish, and equally suddenly die out. I think this is close to Gould’s vision in general, if not in detail.
The other interesting thing is the huge variety of shapes. Some trees are wide, others are narrow, for example:
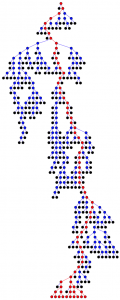
In this case all of the survivors share a common ancestor only a few generations (speciations) ago. This could easily be a model for the very earliest life, since the common ancestor of all current life on earth, who’s closest living relative is likely one of the Archaea, is far too complex to be a “first progenitor”.
I don’t know where I’m going with this from here, probably nowhere, but I think it’s interesting.
To finish off, here’s the full implementation of the tree generating code in case you want to try it yourself. You can pick up GraphViz from www.graphviz.org and run it from the command-line (the commands are called
dot ,
neato ,
circo etc.) or via a gui.
1 2 3 4 5 6 7 8 9 10 11 12 13 14 15 16 17 18 19 20 21 22 23 24 25 26 27 28 29 30 31 32 33 34 35 36 37 38 39 40 41 42 43 44 45 46 47 48 49 50 51 52 53 54 55 56 57 58 59 60 61 62 63 64 65 66 67 68 69 70 71 72 73 74 75 76 77 78 79 80 81 82 83 84 85 86 87 88 89 90 91 92 93 94 95 96 97 98 99 100 101 102 103 104 105 106 107 108 109 110 111 112 113 114 115 116 117 118 119 120 121 122 123 124 125 126 127 128 129 130 131 132 133 134 135 |
#! /usr/bin/perl use strict; use warnings; use Carp qw(confess); use constant MAX => 50; my $max = shift || MAX; sub heads { return rand > 0.5; } sub iterate { my ($sub, @nodes) = @_; while (@nodes) { my $node = shift @nodes; push @nodes, $sub->($node); } } sub mark_ancestry { my ($node) = @_; while ($node) { return if $node->{survived}; $node->{survived} = 1; $node = $node->{parent}; } } sub free { my @nodes = @_; iterate(sub { my ($node) = @_; $node->{parent} = 0; return $node->{l} ? ($node->{l}, $node->{r}) : (); }, @nodes); } sub cull { my ($tree, $depth) = @_; iterate( sub { my ($node) = @_; if ($node->{depth} == $depth) { if ($node->{l}) { free($node->{l}, $node->{r}); $node->{l} = $node->{r} = 0; } mark_ancestry($node); } elsif ($node->{l}) { return ($node->{l}, $node->{r}); } return (); }, $tree); } sub make_tree { for (;;) { my $tree = { n => 0, live => 1, depth => 1, parent => 0 }; my @nodes = ($tree); my $n = 0; my $maxdepth = 0; while (@nodes) { my $node = shift @nodes; if ($node->{depth} == $max) { cull($tree, $max); return $tree; } if (heads) { my $l = { n => ++$n, depth => $node->{depth} + 1, parent => $node, }; my $r = { n => ++$n, depth => $node->{depth} + 1, parent => $node, }; $maxdepth = $node->{depth} > $maxdepth ? $node->{depth} : $maxdepth; $node->{l} = $l; $node->{r} = $r; push @nodes, $l, $r; } else { $node->{died} = 1; } } free($tree); } } sub print_tree { my ($tree) = @_; print "digraph G {\n"; iterate(sub { my ($node) = @_; my $fillcolor = $node->{survived} ? 'red' : $node->{died} ? 'black' : 'blue'; print ' N' . $node->{n} . qq' [label="", style="filled",' . qq' fillcolor="$fillcolor" shape="circle"];\n'; if ($node->{l}) { my ($lcolor, $rcolor) = ('blue', 'blue'); $lcolor = 'red' if $node->{l}{survived}; $rcolor = 'red' if $node->{r}{survived}; print ' N' . $node->{n} . ' -> N' . $node->{l}{n} . qq' [ color="$lcolor",' . qq' arrowhead="none" ];\n'; print ' N' . $node->{n} . ' -> N' . $node->{r}{n} . qq' [ color="$rcolor",' . qq' arrowhead="none" ];\n'; return ($node->{l}, $node->{r}); } else { return (); } }, $tree); print "}\n"; } print_tree(make_tree); |

